Debugging GitHub's Pinned Items Performance Issue in Safari
07 Oct 2025I recently encountered a frustrating performance issue on GitHub’s profile settings page. When trying to pin repositories to my profile, each checkbox click would freeze for several seconds in Safari, but worked instantly in Firefox. This is a case study of how I used Safari’s Timelines tool to track down the root cause.
The Problem
On GitHub’s “Edit pinned items” dialog, clicking a checkbox to pin/unpin a repository had a 3-4 second delay before the checkbox would visually update - but only in Safari. Firefox was instant.
Initial Investigation
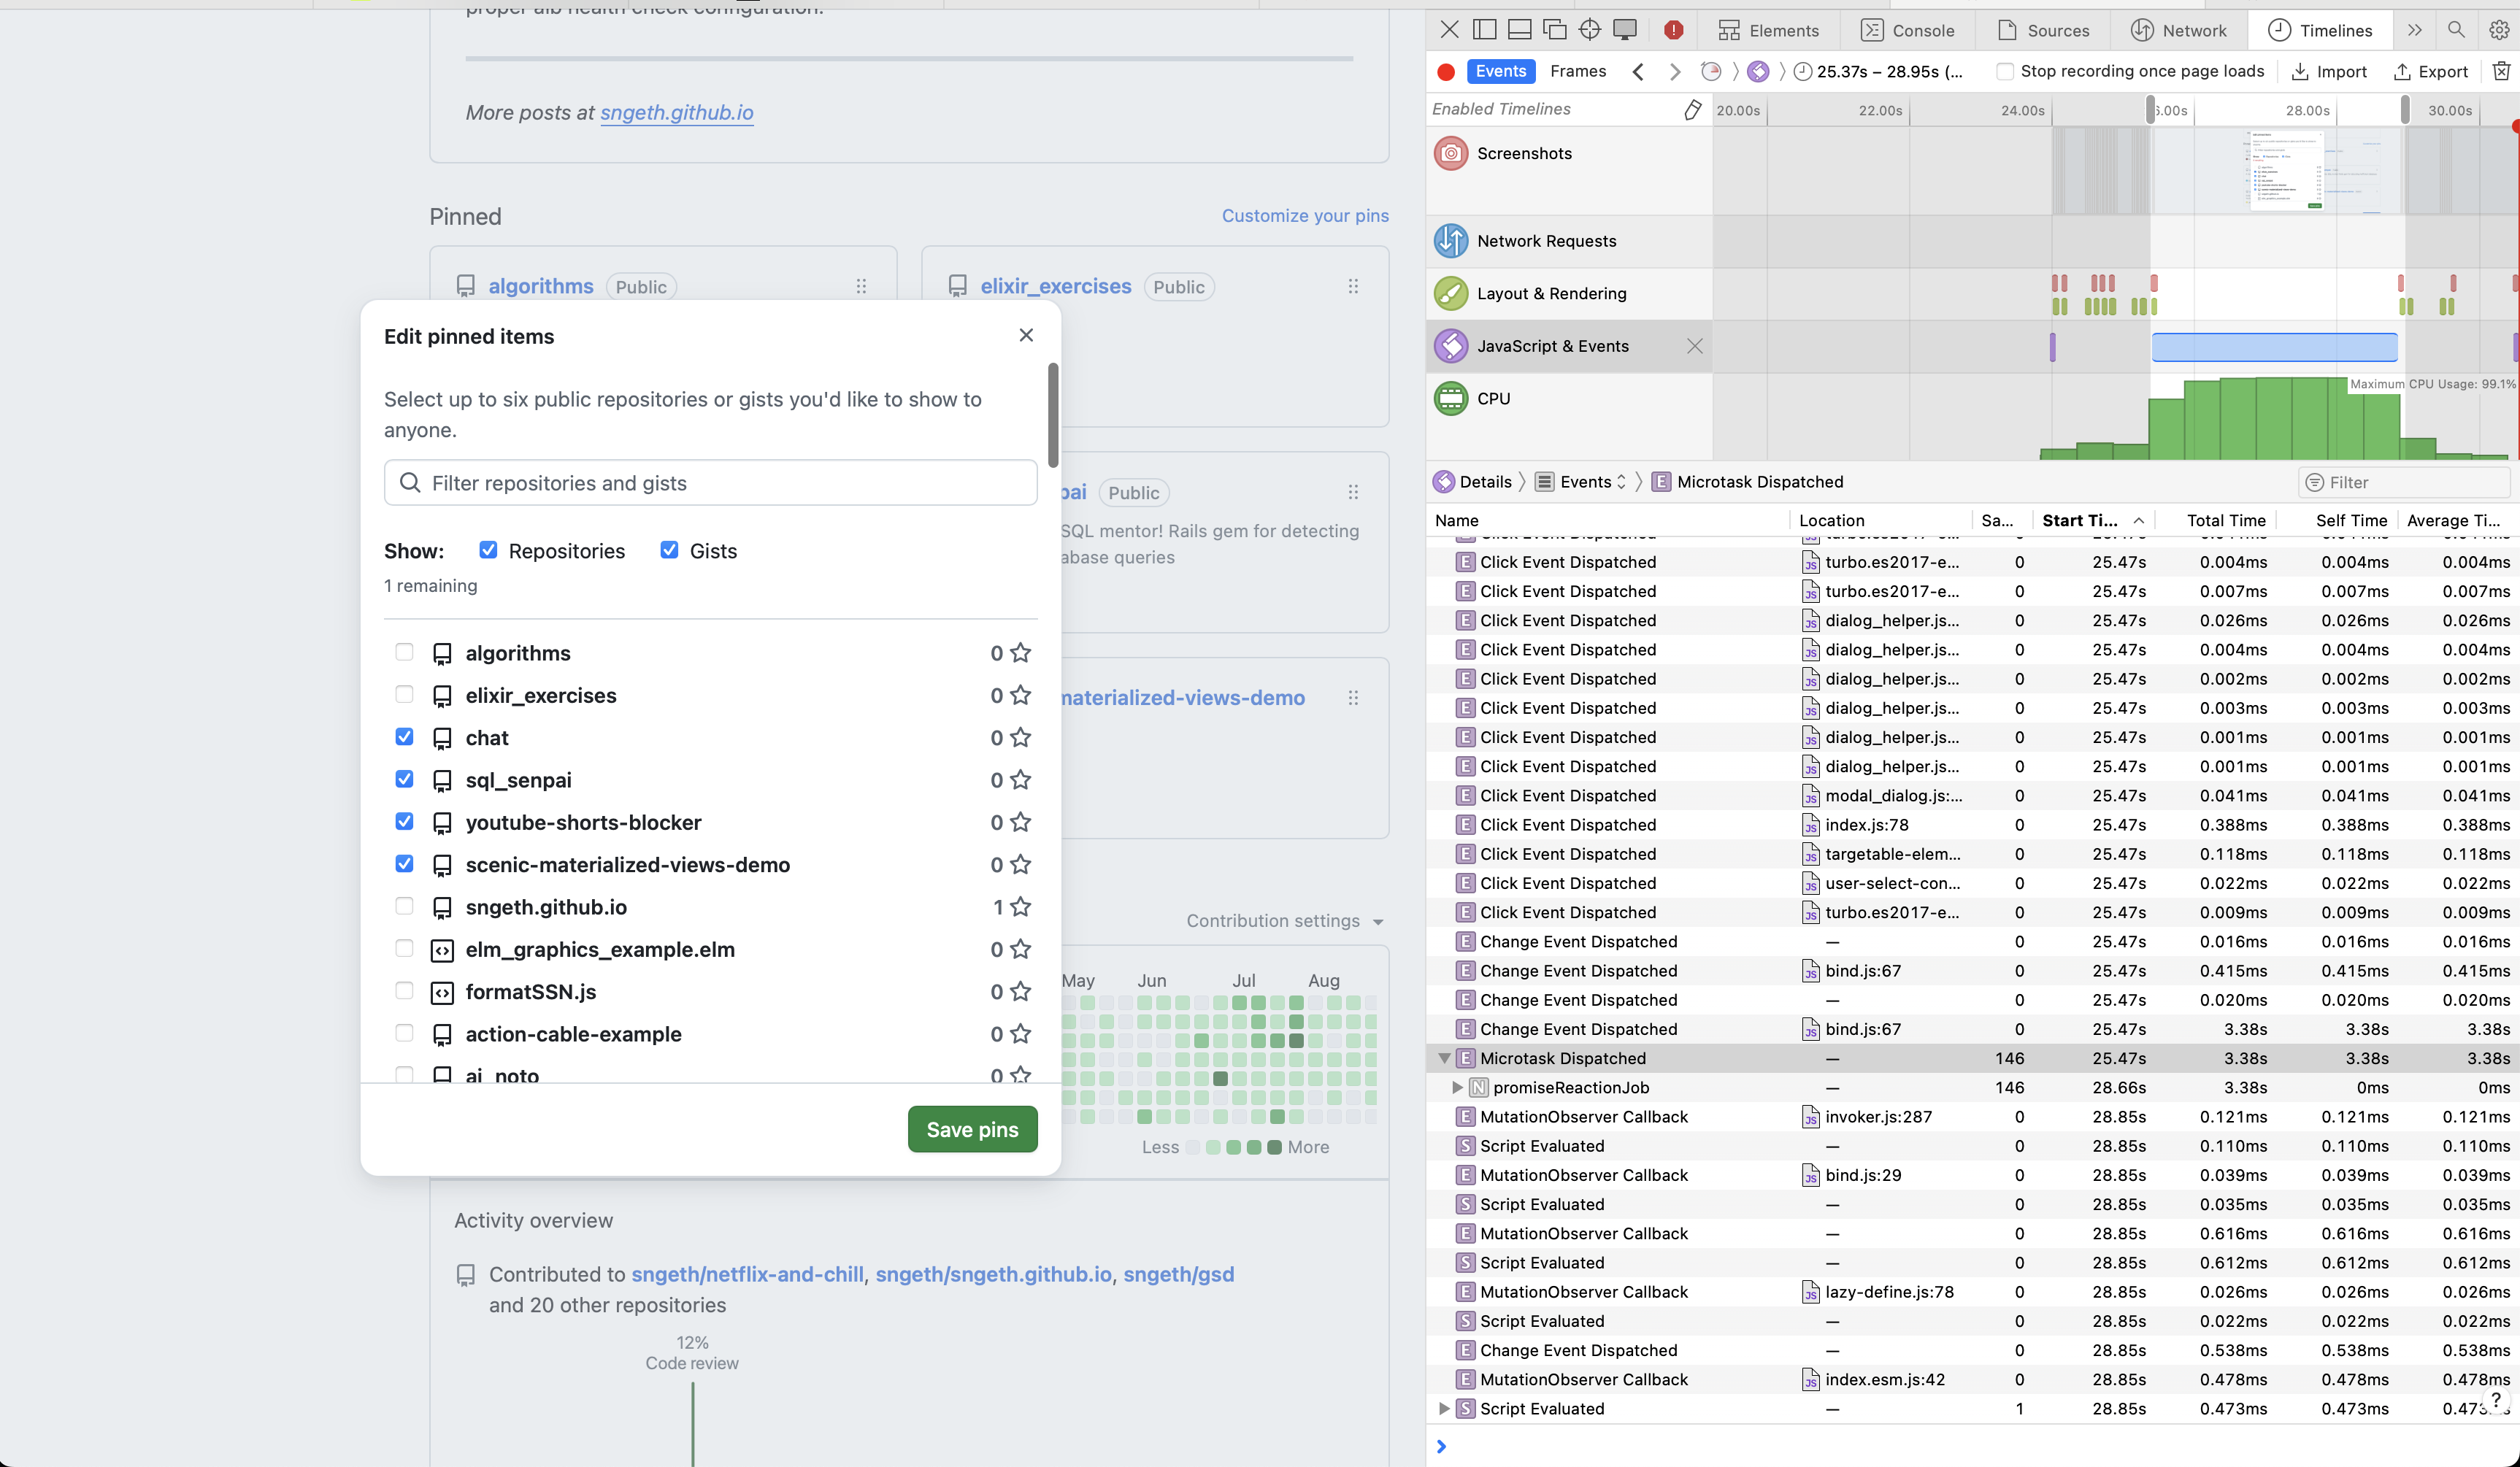
My first instinct was to determine if this was a backend or frontend issue. I opened Safari DevTools and recorded a Timeline profile while clicking a checkbox.
What I Found
The Timeline showed:
- Minimal network activity - No API calls during the delay
- Fast JavaScript execution - Initial event handlers completed in ~43ms
- Long Layout & Rendering gap - Seconds of nothing happening
- Massive JavaScript & Events block - A 3.5 second JavaScript execution block
This ruled out backend issues. The problem was entirely in the frontend.
Digging Deeper
I added some instrumentation to measure the checkbox event handling:
document.querySelectorAll('input[type="checkbox"]').forEach(checkbox => {
  checkbox.addEventListener('change', (e) => {
    console.time('checkbox-change');
  }, true);

  checkbox.addEventListener('change', (e) => {
    console.timeEnd('checkbox-change');
  }, false);
});
The result: 43ms. The JavaScript completed quickly, but the visual update took 3+ seconds.
This was confusing - if JavaScript finished in 43ms, why did it take seconds to render?
The Real Culprit
Looking more carefully at the Timeline, I noticed a second “Change Event Dispatched” that took 3.47 seconds. The 43ms I measured was just the first event handler.
Clicking into that slow event revealed the call stack pointing to bind.js:67 - part of GitHub Catalyst, GitHub’s web component framework.
The Catalyst Event System
GitHub uses Catalyst’s event binding system. Here’s the handleEvent function from bind.ts:
function handleEvent(event) {
  const el = event.currentTarget;
  for (const binding of bindings(el)) {
    if (event.type === binding.type) {
      const controller = el.closest(binding.tag);
      if (controllers.has(controller) && typeof controller[binding.method] === 'function') {
        controller[binding.method](event);
      }
      // ... Shadow DOM handling
    }
  }
}
This routes events to web component controller methods. In this case, the checkbox change event was calling ProfilePinsElement.limitPins().
The Performance Bug
Here’s the limitPins() method from GitHub’s source:
async limitPins() {
  await Promise.resolve()
  const checkboxes = this.checkboxes  // queries ALL checkboxes
  const used = checkboxes.filter(el => el.checked).length
  const limit = parseInt(this.getAttribute('max')!, 10)

  for (const el of checkboxes) {
    el.disabled = used === limit && !el.checked
  }

  const label = this.limitNotice.getAttribute('data-remaining-label') || ''
  const diff = limit - used
  this.limitNotice.textContent = `${diff} ${label}`
  this.limitNotice.classList.toggle('color-fg-danger', diff < 1)
}
The issue? Scale.
The dialog loads up to 100 pages of repositories (controlled by autoreloadCount = 100). For a user with 100+ repositories, this means:
this.checkboxesqueries 100+ checkbox elements from the DOM.filter(el => el.checked)loops through 100+ checkboxesfor (const el of checkboxes)loops through 100+ again setting.disabled- Each
.disabled = ...triggers:- Style recalculation (
:disabledpseudo-class) - MutationObserver callbacks
- Layout updates
- Style recalculation (
100+ DOM property updates × Safari’s slower DOM performance = 3.5 seconds
Why Safari and Not Firefox?
Safari’s JavaScript engine (JavaScriptCore) and rendering engine (WebKit) are notoriously slower at certain DOM operations compared to Firefox’s SpiderMonkey and Gecko:
- DOM property access (
.checked,.disabled) - Style recalculation for pseudo-classes
- MutationObserver callbacks
- Layout computation
Firefox brute-forces through the inefficiency faster. Safari exposes the O(n²) behavior more clearly.
The Fix
The proper fix would be to only update checkboxes that actually need their disabled state changed:
async limitPins() {
  await Promise.resolve()
  const checkboxes = this.checkboxes
  const used = checkboxes.filter(el => el.checked).length
  const limit = parseInt(this.getAttribute('max')!, 10)

  for (const el of checkboxes) {
    const shouldDisable = used === limit && !el.checked
    // Only update if it needs to change
    if (el.disabled !== shouldDisable) {
      el.disabled = shouldDisable
    }
  }
  // ... rest
}
This would reduce the number of DOM mutations from 100+ to typically just a few. Most checkbox clicks don’t actually require any disabled state changes - only when you hit or leave the 6-item limit. By checking if the value needs to change first, you go from 100+ DOM mutations on every click to 0 mutations for most clicks, and ~94 mutations only when crossing the limit threshold.
Key Takeaways
- Browser differences matter - Performance issues may only manifest in certain browsers
- Safari Timelines is powerful - The visual breakdown of JavaScript, Layout, and Rendering clearly showed where time was spent
- Look at ALL the events - I initially missed the second, slower event handler
- Scale reveals bugs - This code probably works fine with 10 repos, but breaks down at 100+
- Check your assumptions - I thought it was React, turns out it was web components (Catalyst)
Tools Used
- Safari DevTools > Timelines tab - Visual breakdown of performance
- Console timing -
console.time()/console.timeEnd()for quick measurements - Network tab - Rule out backend issues
- Call stack inspection - Find the actual slow code
If you’re experiencing performance issues in your web apps, Safari’s Timelines tool is an excellent starting point for investigation. The visual breakdown makes it easy to see whether you’re blocked on JavaScript, layout, rendering, or network.