Integrating Prometheus for Monitoring a Rails Application
04 Oct 2024Monitoring is a crucial aspect of maintaining the reliability and performance of any application. In this post, we’ll explore how to integrate Prometheus, a free and open-source monitoring system, with a Ruby on Rails application for observability. We’ll cover tracking HTTP requests and exceptions, visualizing metrics, and setting up alerts, all using open-source tools.
What is Prometheus?
Prometheus is a powerful monitoring and alerting toolkit designed for recording real-time metrics in a time-series database. It allows you to scrape metrics from your application and provides a flexible query language, PromQL, for analyzing them.
Setting Up Prometheus with Rails
To integrate Prometheus into your Rails application, you will need to follow these steps:
1. Install the prometheus-client Gem
Add the prometheus-client gem to your Gemfile:
gem 'prometheus-client'
Then run:
bundle install
2. Configure Metrics in an Initializer
Create a new initializer (e.g., config/initializers/prometheus_metrics.rb) and set up your metrics:
require "prometheus/client"

prometheus = Prometheus::Client.registry

# Counter for HTTP requests
http_requests = prometheus.counter(:http_requests_total, docstring: "A counter of HTTP requests made.", labels: [:method, :path])

# Counter for exceptions
http_exceptions = prometheus.counter(:http_exceptions_total, docstring: "Total number of exceptions raised.")

# Expose metrics for Rails requests
ActiveSupport::Notifications.subscribe("process_action.action_controller") do |name, start, finish, id, payload|
  http_requests.increment(labels: { method: payload[:method], path: payload[:path] })
end
3. Handle Exceptions with Notifications
In your ApplicationController, use ActiveSupport Notifications to capture exceptions:
# app/controllers/application_controller.rb
class ApplicationController < ActionController::Base
  # Emit a notification for unhandled exceptions
  rescue_from StandardError do |exception|
    # Notify about the exception
    ActiveSupport::Notifications.instrument("exception.action_controller", exception: exception)

    # Optionally log the exception
    Rails.logger.error(exception.message)

    # Render a generic error message
    render plain: 'Internal Server Error', status: :internal_server_error
  end
end
And subscribe to this notification in your initializer:
# Subscribe to the exception notification
ActiveSupport::Notifications.subscribe("exception.action_controller") do |name, start, finish, id, payload|
  http_exceptions.increment
end
4. Expose a Metrics Endpoint
To collect and expose your application’s metrics efficiently, you can use Prometheus middleware in your Rack configuration. This middleware automatically handles metrics collection and exposure, making it easy to get started.
# config.ru
require 'rack'
require 'prometheus/middleware/collector'
require 'prometheus/middleware/exporter'

use Rack::Deflater
use Prometheus::Middleware::Collector
use Prometheus::Middleware::Exporter

run Rails.application
With this setup, the middleware will automatically expose your Prometheus metrics at the /metrics endpoint, allowing Prometheus to scrape the data without the need for additional controller actions.
Benefits of Using Standardized Metrics
-
Automatic Collection: The middleware collects standardized metrics such as request counts, response times, and error rates without any manual coding required. This minimizes the chances of errors in metric implementation and ensures consistency across different applications.
-
Simplicity: By leveraging standardized metrics, you can avoid the overhead of managing custom metrics unless absolutely necessary, allowing you to focus on your application’s core functionality.
When to Use Custom Metrics
While standardized metrics cover many common use cases, there may be instances where custom metrics are essential to capture specific aspects of your application’s performance or business logic.
-
Tailored Insights: Custom metrics allow you to track unique user interactions or application performance indicators that standardized metrics might not address.
-
Greater Flexibility: Implementing custom metrics provides you the flexibility to adapt your monitoring strategy as your application evolves. However, keep in mind that this approach may require additional maintenance and careful planning to ensure that the metrics remain relevant and accurately reflect your application’s behavior.
In summary, using the middleware to expose a /metrics endpoint provides a quick and efficient way to leverage the power of Prometheus in your Rails application, whether through standardized metrics or tailored custom ones.
5. Start Prometheus
Make sure you have Prometheus installed and running. Use a configuration file (e.g., prometheus.yml) to define your scrape configuration:
scrape_configs:
  - job_name: 'rails_app'
    static_configs:
      - targets: ['localhost:3000']  # Adjust the port if needed
6. Access the Prometheus Web Interface
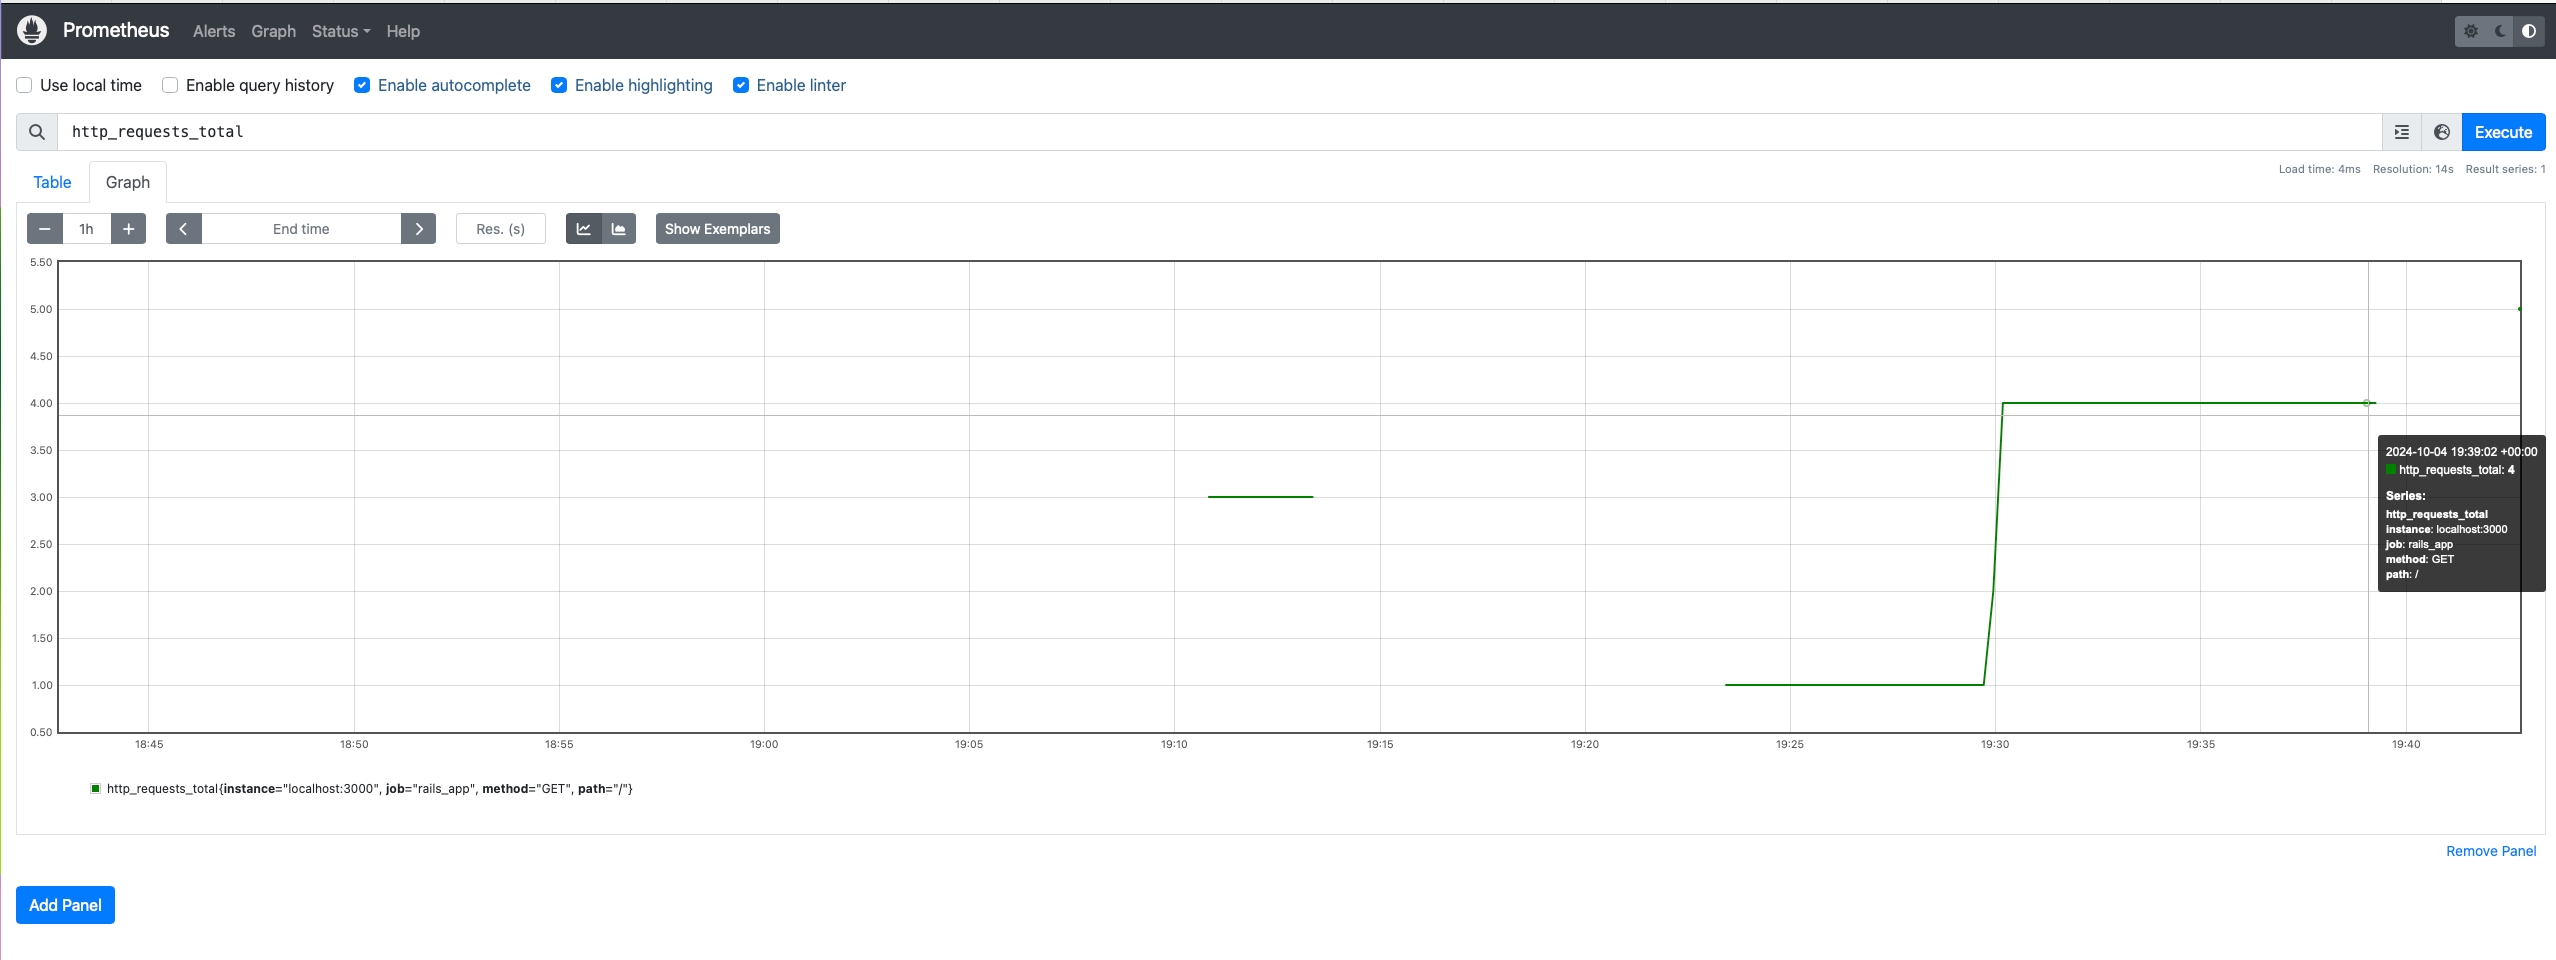
Prometheus provides a built-in web interface to view metrics. You can access it at http://localhost:9090. Use the Graph tab to query metrics using PromQL.
7. Setting Up Grafana (Optional)
While Prometheus has a web interface, many users prefer to visualize metrics using Grafana. You can find installation instructions on the Grafana website.
Start Grafana on a different port (e.g., 3001 set in the grafana.ini or defaults.ini if you run rails on 3000):
grafana server # you will have to login with default user and pass admin/admin
Add Prometheus as a data source in Grafana by navigating to Configuration > Data Sources and selecting Prometheus.
8. Alerts with Prometheus
To set up alerts, define alerting rules in your Prometheus configuration. For instance, you can create an alert for exceptions:
groups:
  - name: alerting_rules
    rules:
      - alert: HighHttpExceptions
        expr: http_exceptions_total > 10
        for: 5m
        labels:
          severity: critical
        annotations:
          summary: "High number of HTTP exceptions"
          description: "More than 10 exceptions in the last 5 minutes."
Viewing Metrics Without Grafana
You can view Prometheus metrics directly without Grafana. Use the Prometheus web interface to run queries and visualize metrics as graphs. Simply navigate to http://localhost:9090 and explore the metrics.